Marketing automation provides businesses with a lot of options and power to make specific choices about who, when, what, and how to communicate with contacts. To avoid getting lost in a sea of options, get actionable feedback by measuring the performance of the campaign and automation emails you send.
But one size does not fit all—the tactics that work best for one business may not work as well for another business. In this guide, we’ll take a look at some example measurements for different types of businesses.
Campaign Engagement Rates
Keep an eye on the open and click rates of your campaigns to gauge how engaged your contacts are with your marketing.
The open rate is a percentage of the number of unique opens of a campaign email, divided by the total number of sends.
The click rate is a percentage of the number of unique clicks in a campaign email, divided by the total number of sends.
The larger your list, the more care you must take in keeping your open and click rates up. This means sending super targeted emails to your contacts based on interest and behavior, and avoiding frequent email blasts to your entire list.
Example
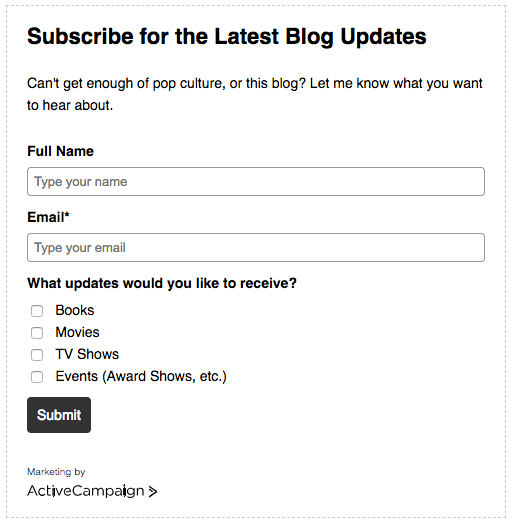
A pop culture blogger wants to send new post updates to their contacts. First, the blogger can use a form to find out which subjects their contacts are most interested in: books, movies, TV shows, and special events such as award shows.
Next, the blogger can use an automation to apply interest tags to their contacts, based on their responses:
The blogger can now use the interest tags to segment their contacts and send only the most relevant campaigns to each contact. That is, contacts who have the “TV Shows” tag can be targeted with campaign emails containing the blogger’s newest content about TV shows. And contacts interested in special events can receive the information they want from the blogger regarding special events. Etcetera.
By targeting contacts with the content they’re most interested in, the blogger can keep engagement high. To track engagement, they can review the open and click rates for each campaign in the Campaigns Performance Report.
When you’re first getting started, 20% email open rates and 1-3% click rates are solid baseline rates. Mailing with care will help increase these rates over time, as your email deliverability rates improve.
Goal Performance
Our Goals feature is a useful tool for measuring how your contacts are responding to your marketing automation. In ecommerce, reviews can have a big impact on your business. In this example, we’ll build an automation to ask customers who made a recent purchase to submit a review. The goal—or desired result of this automation, is to get more customer reviews. If you start to see more customer reviews coming in from contacts who enter this automation, you know that your marketing automation is working.
Example
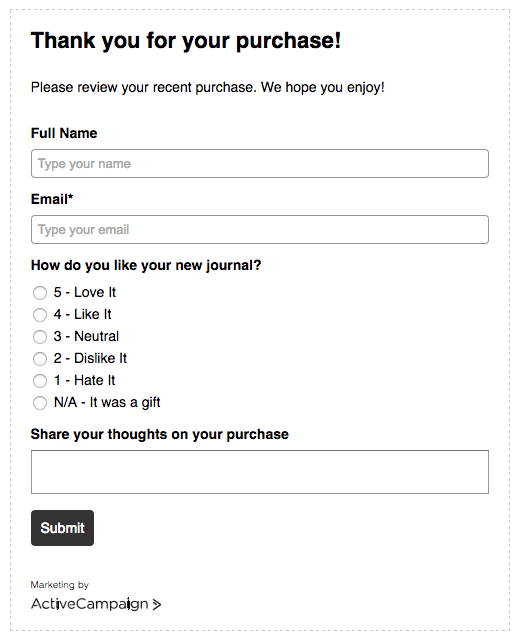
The automation begins when a customer purchases a journal product your company offers. After one day, a thank you email is sent, asking the customer to visit a review page and fill out a form to rate the product they received:
When a contact completes this form, they will achieve the Goal: Completed Review.
After the automation is active, return to the Automations section of the platform, and find your automation. In the Automation Stats to the right, you can see how many goals are in your automation, and view a goal’s completion rate.
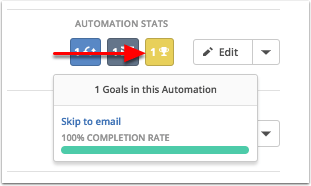
A good completion rate will depend on what your goal is—some goals may naturally convert better than others, so keep an eye on this metric to get a better feel for what’s working and what isn’t. Generally, goal completion rates should improve as you build trust with your list and sell more products.
If you’re interested in other ways to measure the success of your automations, check out our automation stats Help article.
Pipeline Performance
Processes are vital in every business. You can use our Deals CRM to manage your sales process and track the performance of your pipeline.
Example
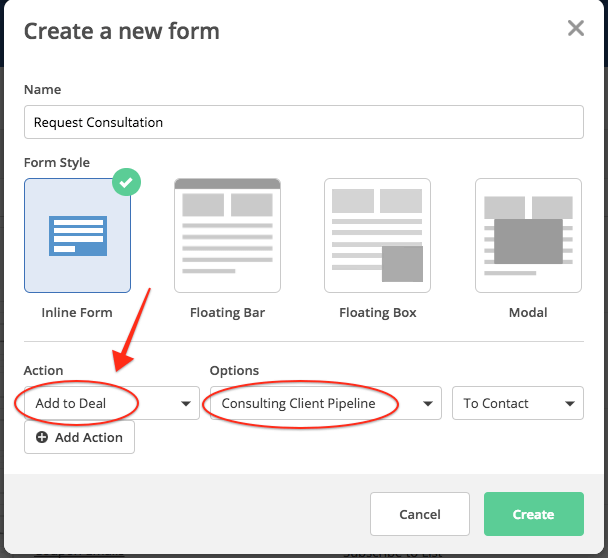
A consultant wants to keep track of interested clients by creating a new deal every time someone requests a consultation.
They can begin with a form that adds a deal to their consulting pipeline when someone completes their “Request Consultation” form.
New deals will be added to the “To Contact” stage of the Consulting Client Pipeline. There is also an “In Contact” stage, for when a team member has reached out, and a “Re-engage” stage, for the revival of a deal. Lastly, the consultant uses a “Closed” stage to signify that a deal has gone cold.
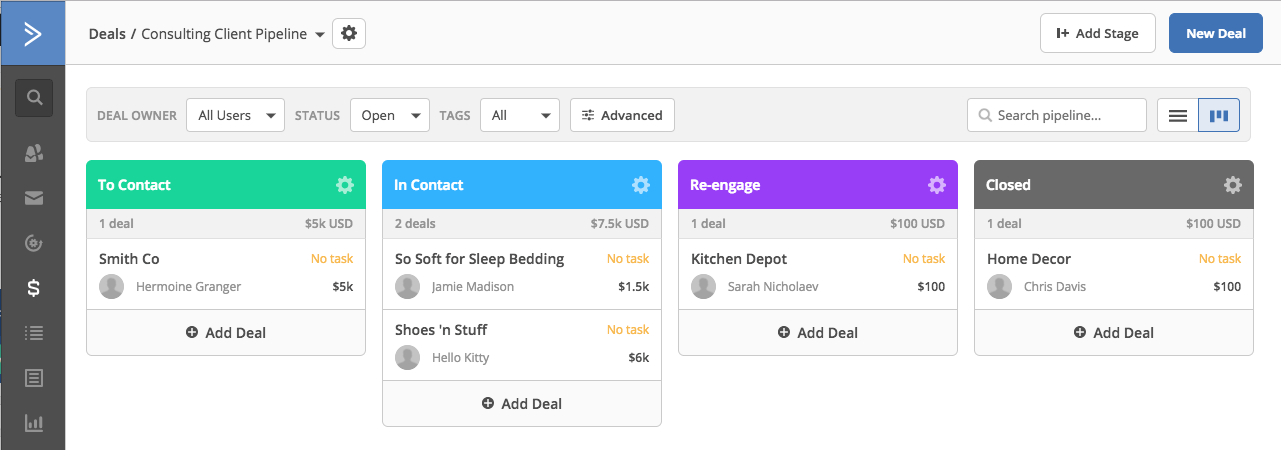
When a deal is won or lost, the consultant simply drags and drops the deal card into the appropriate box (see the animation below). That deal will no longer be visible in the Status: Open view; it will now appear in the same stage, but in the Won or Lost view. This allows the consultant to track which stages deals are won or lost in, and see any patterns that emerge, such as where most business is converting, or if a lot of deals are being lost in a particular stage.
Over time, the consultant can learn:
- The approximate value of their pipeline
- The value of deals won, and the stage where most convert
- The value of deals lost, and the stage where most are lost
You can also learn more about the performance of your sales team from our Deal Owner Overview Report.
