Perhaps the most powerful capabilities of marketing automation are the ability to listen to your contacts, review their responses, and tailor your responses and messages accordingly. ActiveCampaign is designed to automate your entire marketing process, as opposed to just focusing on outbound messaging.
There are many facets of ActiveCampaign that will help marketers leverage and act upon their data. This guide will explain different ways to search, understand, and act upon your data. For more information, check out our guide on measuring your marketing.
Data in Campaigns
Campaigns are often the first stop in the adoption of a marketing automation platform. Campaigns are a one-time send to a designated list and/or segment. They are a quick way to send a message out to a particular group of contacts. (You can learn about our campaign types in our Guide to Campaigns.)
After you send a campaign, you will have access to some important data. The summary of sent campaigns in the Campaign tab will display when you sent your message, how many people you sent your message to, and list the type of campaign it was. Lastly, you will have the option to View Report.

Clicking on “View Report” will bring you to the Reports tab. The tab will display an overview with the daily open trend.
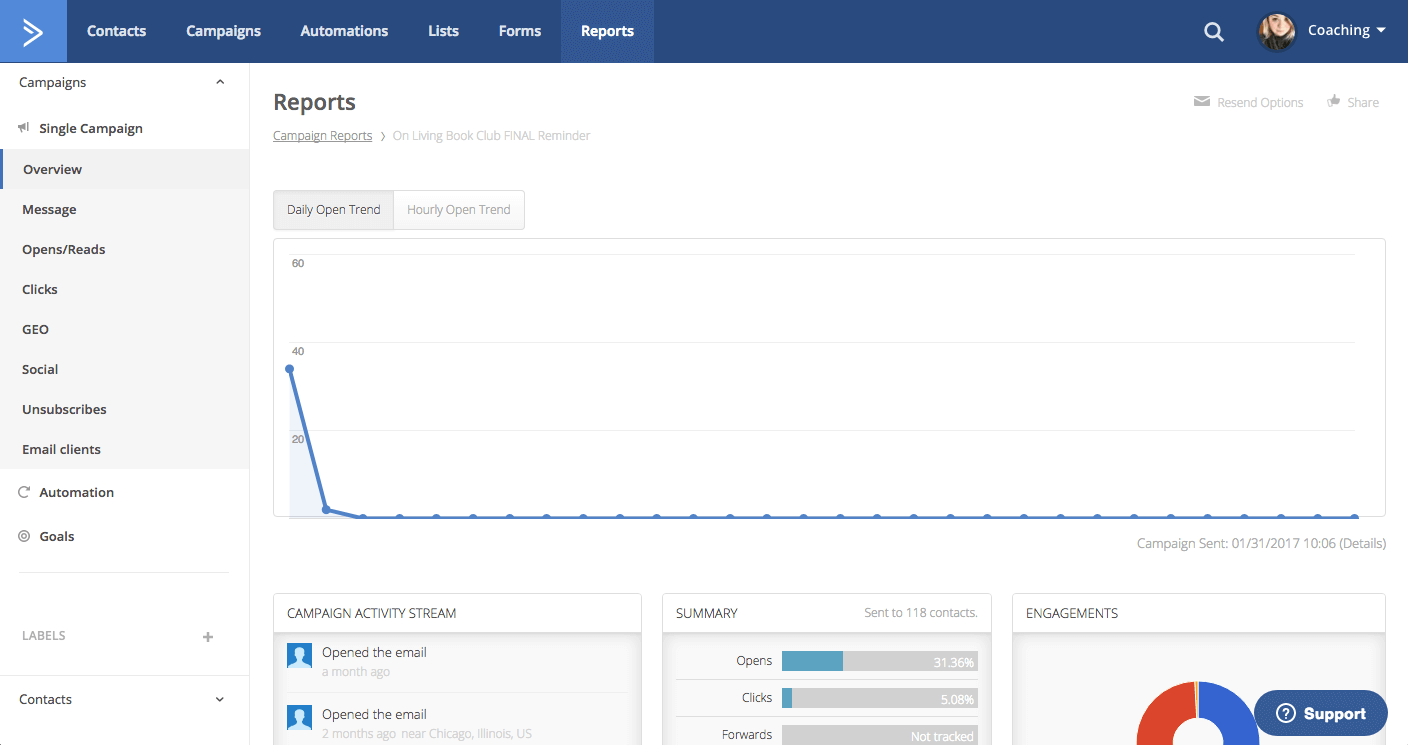
Most campaigns will mostly be opened on the day they are sent. To learn more about how your audience behaves, the “Hourly Open Trend” button above the chart will show what time most people open your communication.
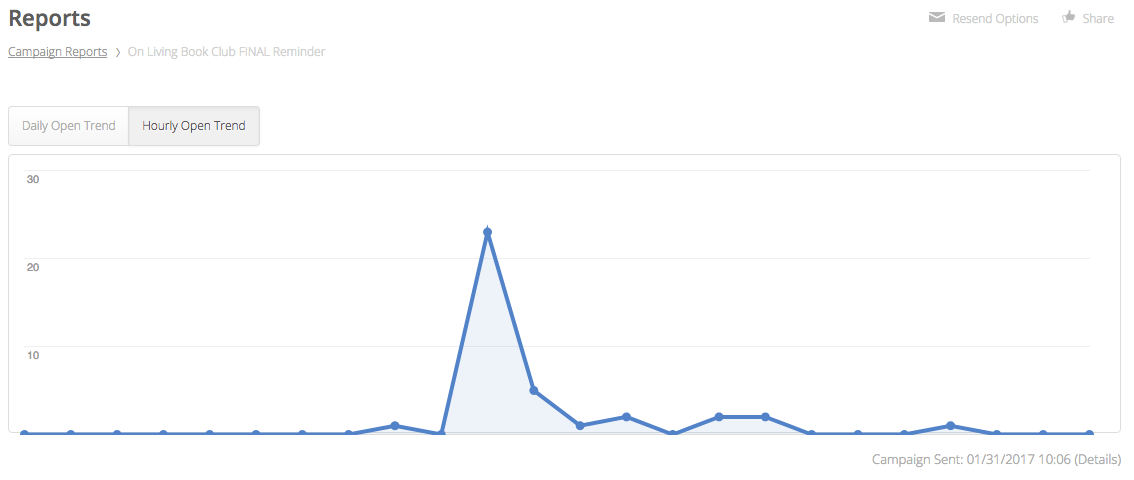
Pay attention to this information over time; you can try sending your campaigns at different times, and see what time they are opened most frequently.
The left navigation has many options that are useful.
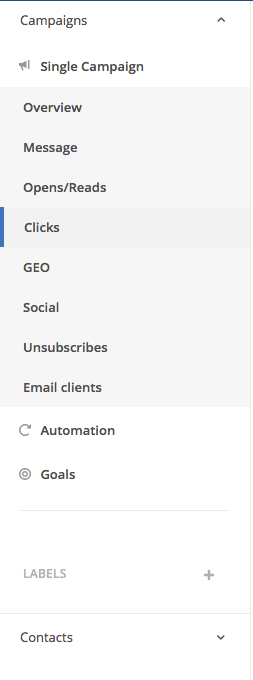
The Open/Reads report displays the total number of opens and reads, including unique reads, and the number of contacts who did not open.

You can also sort the contacts you’ve sent the campaign by Opened or Unopened, and any relevant tags.
You can also view and sort link clicks, the geography of where your contacts are located, social shares, unsubscribes, and email clients, which lets you know what email provider your contacts are utilizing.
Data in Automations
While in the Reports tab, you can also view data on completed automations. The tab will list all of your automations, the number of people who interacted with your automation, and how many completed the automation.

The Reports tab will also display all of your goals, and their rate of success. Because goals are very customizable, this gives you the opportunity to decide what you would like your contacts to accomplish, and track their progress through your automations.
Contact Data
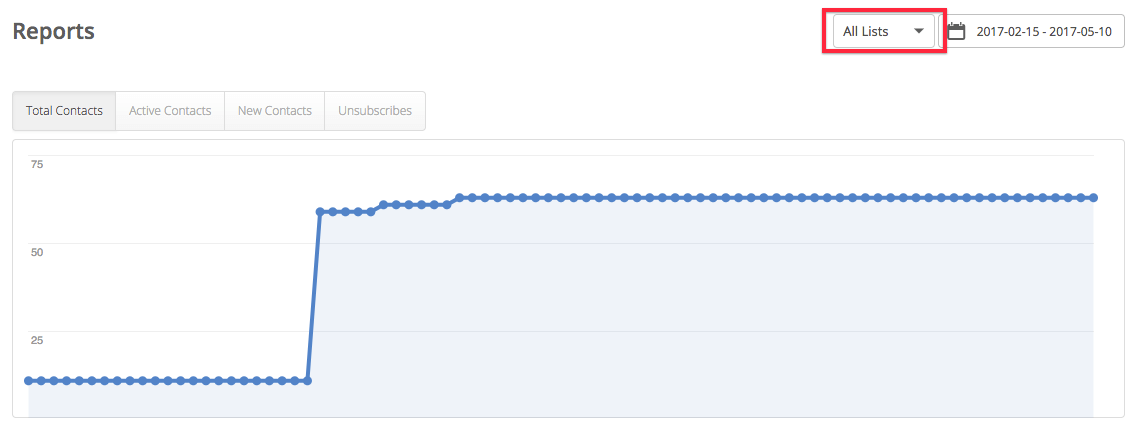
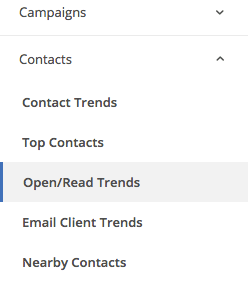
The Reports tab also includes contact data, including trends. You can view a graph to see your contact growth over any designated time period.

You can view this data by list by utilizing the drop-down menu in the upper right.
The next several options will show you how your contacts interact with your communications, and at what time. Open/Read trends lists the days people most often open your communications. It also breaks it down by hours they are most often opened. Email client trends let you know what email services your contacts are using most frequently, and nearby contacts allow you to sort your contacts by geography.
Using all of this data, you can determine several things:
- What day of the week to send emails
- What time of day to send emails
- What special considerations will you make for email clients? For example, asking Gmail contacts to drag your emails out of the “Promotions” folder into their inbox for future communications
- Where your contacts are primarily located when they interact with your marketing, allowing you to target their location, as well as ensure your contacts are in the location you want.
Deals Data
Lastly, for accounts that utilize the Deals CRM, there are reporting metrics available in the Reports tab. You can view an overview of your pipelines, as well as the percentage of open, won or closed deals within each pipeline.

There is also a report by owners, so you can see an overview of the number of deals, as well as their status, associated with each individual team member.

Our Deals Funnel Report will also provide you an overall view of your funnel, displaying how many deals are in each stage of the pipeline. This view includes percentages of deals won and lost, as well as the percentage of how many move to the next stage.

Using Data to make Decisions
With all of this reporting data available, you have several decisions to make. Some, like the best times to send emails, may be more straightforward after some testing. But some decisions may come down to a matter of preference or opinion.
Campaign Suggestions
In order to make the most of your data, we suggest running split test campaigns. Send them with different types of headlines, and see what gets more opens. Send your content in different formats, and see what gets more clicks. By leveraging the reporting tab, you can identify trends in interaction and play to the audience’s preferences.
Automation Suggestions
Automations offer a great opportunity to act on the data you have. Using automations, you can start to try several things, such as:
- Split testing email content
- Using an If/Else to divide your contacts by engagement
- Adding tags to indicate specific interests
As you leverage more automations, you will be able to improve the way you listen to your contacts, and tweak your communications over time.
Summary
The data found in your ActiveCampaign account gives you a lot of great data to respond to and plan around. Marketing automation planning is a moving target, and this feedback will allow you to improve your messaging, timing and responsiveness.
What ways are you leveraging data in your marketing automation? Let us know in the comments below.
