

Let’s get this out of the way – I’m not about to dump 3,000 different content marketing metrics on you and then send you packing.
(Well…I will dump some. But it’s only 44, and only to make a point. And I’ll give you some other info before you go).
Measuring content marketing is hard.
And, unfortunately, the advice you find by Googling “content marketing metrics” isn’t usually that helpful.
A list of 23 numbers that show up in Google Analytics probably has some good info in it. Yeah, it’s often useful to look at organic traffic. And yeah, you can track conversions into leads and customers (to a degree).
But at the same time, that advice is noisy.
Anyone can put together a list of “content marketing metrics” just by scrolling through Google Analytics, social media, a CRM, and an email service provider.
This is the part where I dump a long list of content metrics to make my point. Here are 44 content marketing metrics that you can use to measure stuff:
(but OMG please don’t read the whole list)
- Traffic
- Traffic by source
- Total leads generated
- Number of qualified leads
- Leads (First touch attribution)
- Leads (last touch attribution)
- Leads (multi-touch attribution)
- Sales
- Revenue
- Return on investment
- Pageviews
- Unique pageviews
- Users
- Unique Visitors
- Average time on site
- Average session duration
- Number of comments
- Bounce rate
- Form completions
- Click-through rate
- Open rate
- Conversion rate
- Views
- Impressions
- Percentage of returning vs. new visitors
- Number of visits
- Days since last visit
- Pages per session
- Page depth
- Scroll depth
- Dwell time
- Followers
- Shares
- Subscribers
- Unsubscribe rate
- Retweets
- Likes
- Mentions
- Keyword rankings
- Number of keywords ranking on
- Branded search volume
- Backlinks or natural inbound links
- Paid search equivalent
- Domain Authority / Domain Rating / Domain Score
So you’re all set, right? Now you know how to measure content?
Of course not. Because it doesn’t matter how many things you can measure – the challenge is to measure what matters.
Here’s what this post covers:
- Why measuring content is dangerous, the importance of “feelings” in metrics, and why it might not make sense to measure your content at all
- The 4 reasons no one has really nailed down how to measure content
- How the “audience comparison” approach helps measure the unmeasurable
- A measurement model that’s “good enough” for most businesses
I can’t promise that you’ll come away from this knowing exactly how much money content makes you. The value (and measurement) of content depends on your business.
But I can show you how top content marketers approach measurement.
And I can walk through the basic model that any business can use as a starting point.
Before you start – measuring content can be dangerous
A word of warning: content measurement can be dangerous.
Data-driven marketing is the latest trend, so, data = good, right?
Not always, for three reasons…
- Getting good data takes a ton of work. Getting insight from that data takes even more work! The time spent gathering data might be better spent in other places.
- No measurements perfectly describe reality – there are always important things that your data doesn’t tell you.
- Once you have a measurement, it changes how you act. It’s easy to get tunnel vision and only focus on that measurement.
I was once doing a website redesign project for a client, and they wanted an A/B test to compare the conversion rate of the old page with the new one.
I will forever love the person in the room who asked this question: “If the new page loses, will we go back to the old one?”
The answer was no.
So my advice? Don’t run the test. Sure, look at the analytics afterwards and do a best-guess of the results – but if you aren’t going to make decisions based on the data, it’s not worth the effort to collect it.
There’s an opportunity cost to going all-in on data.
“What gets measured gets managed” is a famous quote from Peter Drucker, and speaks to the importance of measuring things – stuff gets done when you have a number that holds people accountable.
An excellent Harvard Business Review article points out the problem:
“Peter Drucker was right when he wrote: ‘What gets measured gets managed.’ But why is this so often taken to a false corollary like ‘What can’t be measured isn’t worth managing?’”
If you get too focused on measuring, with perfect exactness, every aspect of your content performance, you risk optimizing the wrong thing.
Is it more important to optimize the % of time that someone sees your product while reading a blog post – or would you be better served just by sending more traffic to your website?
You have a lot of options when it comes to measuring your content. So ask – what kind of behavior is this metric incentivizing?
- If you track leads from content, you’ll incentivize creating a ton of lead magnets and forms – because that will show the fastest uptick in the short term
- If you track traffic, you’re incentivizing a lot of top-of-funnel content – whether or not that content generates leads
- If you track number of articles published, that’s what you incentivize – even if the articles themselves suck
No single metric is going to completely capture the value of your content – but it might get treated like it does.

What you reward will change how your team works – in ways you might not have intended. (Source, InfoSurv)
Two adages from the world of social science and economics put a nice little cherry on top of this discussion of the dangers of data:
- Campbell’s Law: “The more any quantitative social indicator is used for social decision-making, the more subject it will be to corruption pressures and the more apt it will be to distort and corrupt the social processes it is intended to monitor.”
- Goodhart’s Law: “When a measure becomes a target, it ceases to be a good measure.”
The very act of measuring something changes how people act. When you measure, people begin to change how they do things so that the measurements look good.
And if you turn a measure into a target or a goal, you can wind up incentivizing the exact wrong behaviors. (Like when the British government tried to wipe out cobras in India – I won’t spoil it, because the cobra effect is a great read).
Numbers and data can hide important information. It’s important to use them as a guide – but it’s just as important to remember what they don’t tell you.
Google Analytics can’t tell you how people feel
“A blog doesn’t grow (or decline) because of raw emotion, but success (or failure) cannot be measured without a holistic set of data points. Google Analytics does not, for example, tell you how people feel about your content and your brand – and that is far more important than page views and bounce rates.” – Jimmy Daly, How Google Analytics Kills Great Blogs
Imagine two articles that both get 10,000 views every month. They generate the same number of leads and conversions.
But one of them is fascinating. It’s the kind of thing that people remember. It’s a post that people love and come back to long after it was first published.
Here’s one example:

People come back to this post again and again and again, because it’s interesting and has long-term value. (You can read it here)
The question is: “would you know?”
Would you know how your content makes people feel? Would you realize that it actually makes them remember you? Where would that show up in your metrics?
As Jimmy Daly wrote in his piece on Google Analytics and feelings, Google Analytics can’t tell you how people feel.
But how people feel is important. He cites the work of economist George Katona – who showed that how people feel can literally predict economic recessions.
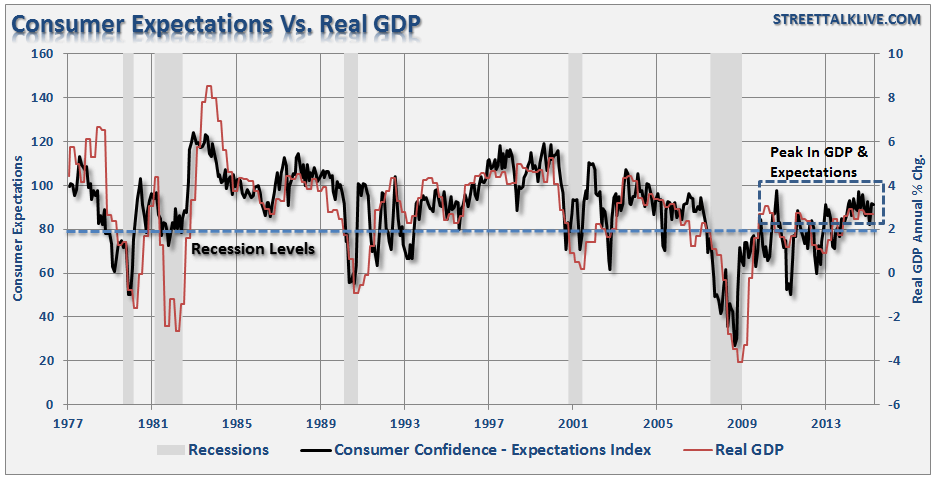
The black line is consumer sentiment. Notice how it drops just before major drops in GDP. Feelings predict the economy. (Source, Investing.com via Animalz)
It’s this kind of research that leads marketers like Jay Acunzo to create metrics like “Unsolicited Response Rate” (URR).
Unsolicited Response Rate is essentially “how many people go out of their way to say that they liked your content.” It doesn’t have a very “data-y” feel to it, and most marketing executives will probably not be fans.
But there’s a sense in which this is a powerful metric – people don’t often go out of their way to give compliments like this. If someone does it for your content, you’re probably doing something right.
If you have a high URR, you’re probably making good content. (Source, Jay Acunzo)
Content marketing isn’t at the point where it can measure how people feel about your content. Or, at least, I’m not aware of anyone doing it successfully.
(In theory, it should be possible – the rise of chatbots and on-site surveys might give you the ability to ask questions about how people feel. Stay tuned in years to come!)
Let’s move on to how people are measuring content marketing. But first, I’ll leave you with one last quote – from world health professor Hans Rosling, writing in his book Factfulness.
“I don’t love numbers. I am a huge, huge fan of data, but I don’t love it. It has its limits. I love data only when it helps me to understand the reality behind the numbers, i.e., people’s lives. In my research, I have needed the data to test my hypotheses, but the hypotheses themselves often emerged from talking to, listening to, and observing people.”
Keep this in mind when you work on your content marketing metrics.
Here’s why no one has figured out how to measure content (yet)
There are 4 big reasons:
- Focus on direct attribution (i.e. person reads content, then becomes customer)
- Metrics that make sense depend on how you’re using content
- There’s a lot of noise. The most visible metrics aren’t the most important metrics.
- Measurement skills and content creation skills don’t usually overlap
In a digital age, it’s possible to track a lot of things that used to be untrackable.
Unfortunately, that also leads to people thinking that everything can be tracked.
And to too many people using “direct attribution” models that essentially try to answer the question “how much money did this blog post make us.”
(Note that there’s nothing inherently wrong with this model, and the guys at Grow and Convert are smart. This makes sense for a lot of businesses – it’s only a problem when it gets used in a business where it doesn’t make sense).
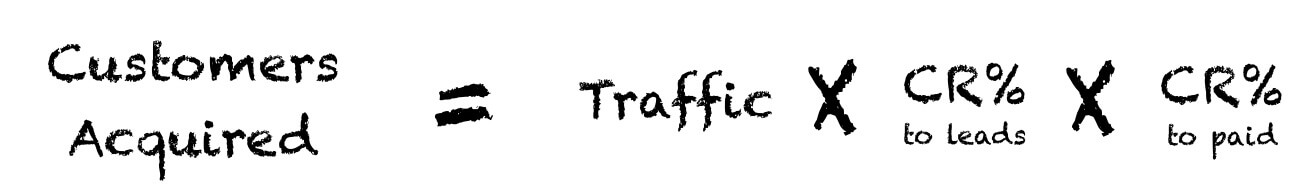
Customers = Traffic x % of traffic that turns to leads x % of leads that turn to customers. (Source, Grow and Convert)
Even though direct attribution can be useful (and at the very least, can sometimes justify the expense of content marketing), it doesn’t make sense for all businesses.
Because the buying process isn’t always this linear.
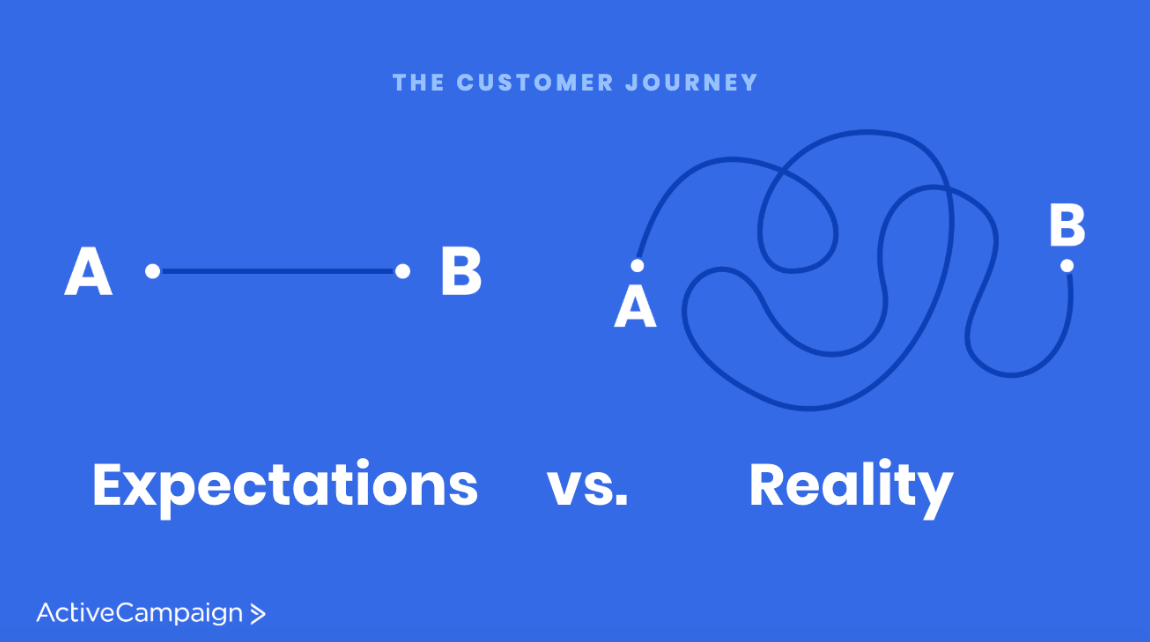
A slide from ActiveCampaign’s founder and CEO, presented at the ActiveCampaign conference
For a lot of businesses, the direct attribution of content drastically underestimates the value of content. It doesn’t account for things like…
- How content helps turn leads → customers (even if the leads didn’t come from content)
- Brand awareness created by spreading your content
- How sales teams use content to close deals
- Customer retention and upsells that are influenced by content
- Content that people remember and come back to – that builds trust long before the person is ready to buy
The metrics that make sense for you depend on how you’re using content.
“Did this blog post make money” is a great question if you don’t have a sales team and most of your leads come from blogging.
On the other hand “can our sales team close deals more efficiently when armed with content” might be a more relevant question for your business (if you have a sales team).
The key is to answer the right question for your business. And that question isn’t always “did this blog post make money.”
“How are people who consume our content different from people who don’t consume our content?”
“Say you visited Moz for the very first time via a Google search for a phrase like “SEO tools,” then immediately signed up for a free trial of our software. Chances are good you’d be a Moz customer for less than four months versus the overall global average of about nine months…
But if you visited Moz twelve times or more in a three-month span before signing up for that free trial, chances are you’d stick around for fourteen-plus months as a paying subscriber. Whoa. I know….
Turns out, our best, most loyal customers tend to be those who’ve spent a considerable time on our website, participating in our community, consuming our educational resources, and testing out our free tools. Thus it’s actually in Moz’ interest not to promote our products or conversions too heavily or too fast, especially to new visitors.” – Rand Fishkin, Founder of Moz and Sparktoro, writing in his book Lost and Founder (emphasis mine)
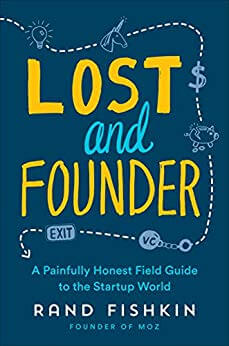
A great read, with great nuggets like this that are hard to find elsewhere (Source, Amazon)
When you want to prove the big-picture value of content marketing, you need to figure out how people who consume your content are different from everyone else.
Robert Rose of the Content Marketing Institute echoes this idea:
“Through CMI’s blog, books, workshops, and master classes, we talk about measuring content marketing by looking at “what do audiences do that others do not.” Look at how subscribed audiences behave differently than others you might be marketing to through other means.”
In a very real sense, this is an A/B test at much greater scale. Instead of asking “do these two pages convert differently” you are asking “do these two audiences convert differently.”
At Moz, the answer was yes – people who visited the site a lot stuck around longer as customers.
At Activate, ActiveCampaign’s conference, Unbounce founder Oli Gardner described a content marketing measurement approach based on similar principles.
Oli’s talk focused on his “Product Awareness Month” experiment, and a major theme of it was designing your content to produce meaningful metrics.
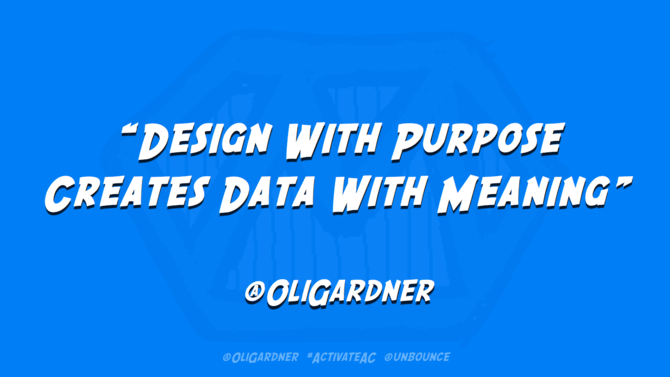
A slide of Oli’s deck at Activate
Check out the difference between these two numbers:
- Visitors watch on average 67% of your video
- 54% of viewers saw the product in action
Is it more important to know how much of your video people watch – or to know how many people saw your product in the video.
When you have the latter metric, you can compare audiences.
Instead of “2% of people sign up for a trial,” you can say something like “People who see the product in action 3+ times convert 18% better than other visitors.”
Once again – this is treating “people who consume content” as different from other audiences. The group here is “people who see the product in action 3 or more times.” The difference in their behavior helps illustrate the value of content.
Expert Insight: Oli Gardner on how to find your meaningful metrics

The biggest problem I see in content marketing is a lack of visibility into what the product being sold actually is, or does. It’s important that content be useful, actionable, education, and entertaining. But if it doesn’t show your product you’re missing your grandest opportunity to succeed.
The key to successfully integrating your product into your content is by developing functional use cases that demonstrate your product being used in ways your audience might not have imagined being possible.
Not everyone can piece together the puzzle of using feature X of product A combined with feature Y of product B to create what’s ostensibly a new mini product, so it’s our job as content marketers to deliver content that delivers on the promise of actionable content combined with demonstrations inside your product.
Content that shows how to solve problems is way more valuable than theory or examples alone.
In my experimentation, by far the most impactful way to do this is with video.
To track it I use a metric I call “Product In View” or PIV. It’s a fairly technical setup using Google Tag Manager, but what it allows you to do is measure the number of product views it takes to create a converting customer, and which features, benefits, and use cases they saw which drove the conversion. Anyone interested in that should reach out directly (oli@unbounce.com) and I can share the video of a talk I did describing it, along with a Trello board of setup instructions.
Robert Rose suggests using the 4Cs to figure out how your audiences are valuable:
- Campaign value: Your normal marketing/advertising become more efficient
- Competency value: You can get valuable data and information by having an audience
- Customer value: You can create better customers through content
- Cash value: Your audience and marketing can be a source of revenue on their own
This isn’t easy stuff – and it’s why there’s no “one-size-fits-all” approach to content marketing measurement.
“See how your content audience is different” is a general approach that works for a variety of businesses. But your specific content audience can be different in any number of ways!
Those ways are unique to you. That’s your challenge – figuring out how your audience is unique.
Some examples:
- “Do sales leads that see our content convert better than those that don’t?”
- “Do people who consume our content buy more (either value or # of products) than people who don’t?”
- “Do targeted offers based on the data you collect from your content audience let you sell more to that group of people?”
These examples are generic, but the answer that makes the most sense for you will probably be specific to your business and buying process.
When you want to prove the value of content marketing without relying on direct attribution, you need to answer this question: “How are people who consume our content different from people who don’t consume our content?”
When is direct attribution “good enough?”
Direct attribution of content marketing is when you track exactly how much money a piece of content makes you. If someone lands on your content and then becomes a customer, you would call that direct attribution.
Direct attribution of “content marketing → money” is “good enough” when content is your main source of leads and “brand awareness” is not a major goal.
If you run a small business…
- You probably don’t need to track every single dollar of revenue back to its source.
- You probably don’t have a very long buying process. It’s makes sense for someone to land on your blog post, go through an email funnel, and buy a product.
- It’s less likely that someone will visit your blog, leave, and come back because they remember your name. “Name recognition” and building broad brand awareness is less of a factor – so you don’t have to try to account for it in your measurements.
Let’s bring back this model from Grow and Convert.
Customers = Traffic x % of traffic that turns to leads x % of leads that turn to customers. (Source, Grow and Convert)
What types of business does this make sense for?
- A business that sells online products or coaching – and attracts customers through content + an email list
- A small business (e.g. accountancy, law firm) that gets most of its leads through content/search (rather than referral, which is more common)
When is this pretty good, but could use a couple of other metrics?
- An ecommerce business trying to get Google traffic to its product pages (content can generate links, which raises domain authority, which helps those pages rank)
- A small business that gets leads from searches like “personal injury lawyer chicago” (same thing – content builds links, which help rankings)
And, frankly, which businesses probably don’t care to measure this at all?
- Small businesses powered by referrals
- Freelancers or agencies who create content, but get more work than they can handle (and therefore don’t need to optimize their lead generation)
For a lot of businesses, this kind of direct attribution model can be really useful. A business that sells online courses can do simple math to find its top-performing content.
Let’s go through a quick example.
(If you don’t like math, here’s the takeaway – one article brings in more visitors, but they both bring in the same number of customers every month because the other article converts better).
- Article 1: 5000 visitors/month → 2% conversion to subscriber → 1% conversion to customer = 1 customer/month.
- Article 2: 20000 visitors/month → 0.5% conversion to subscriber → 1% conversion to customer = 1 customer/month.
If you don’t have that many products (and you know what people buy), you now know exactly how much each article makes you per month – and can think about how to optimize your marketing.
Both of these articles bring in the same amount of business – but they do it in different ways. With that knowledge, here are some things you might look at optimizing for those two articles:
- Article 1 converts better – is there a way to get more traffic? Maybe look at keywords that it’s almost ranking for, and optimize the post for search?
- Article 2 gets more traffic – is there a way to get more conversions? Are my forms prominent, with compelling opt-in copy?
This kind of tracking isn’t too hard to set up – a Google Analytics goal plus tags/custom fields in your email automation system can help you connect the dots.
And if you’re small, this is all you really need. You may not need to use the big-picture “audience comparison” approach to measuring content.
As long as you know that you’re moving in the right direction, it’s not as important for you to have “1 number” that shows all of your content’s value.
But there are still metrics that can be useful – because they help you get better results out of the content you already have.
Content marketing metrics that help you improve your content
The “audience comparison” approach to measuring content helps you understand the overall value of content to your business.
But how do you know if individual pieces of content are “working?”
If it doesn’t make sense for you to measure “money from blog posts” directly, what metrics can you use to figure out how to improve your content?
In fact, what does “improving your content” even mean in this context? It could mean…
- Getting more people to find your content
- Getting more people to read your content
- Getting more people to convert from your content
Most people turn to Google Analytics and Google Search Console when they work on optimization.
Here’s an example of a month of traffic from a site I worked on.
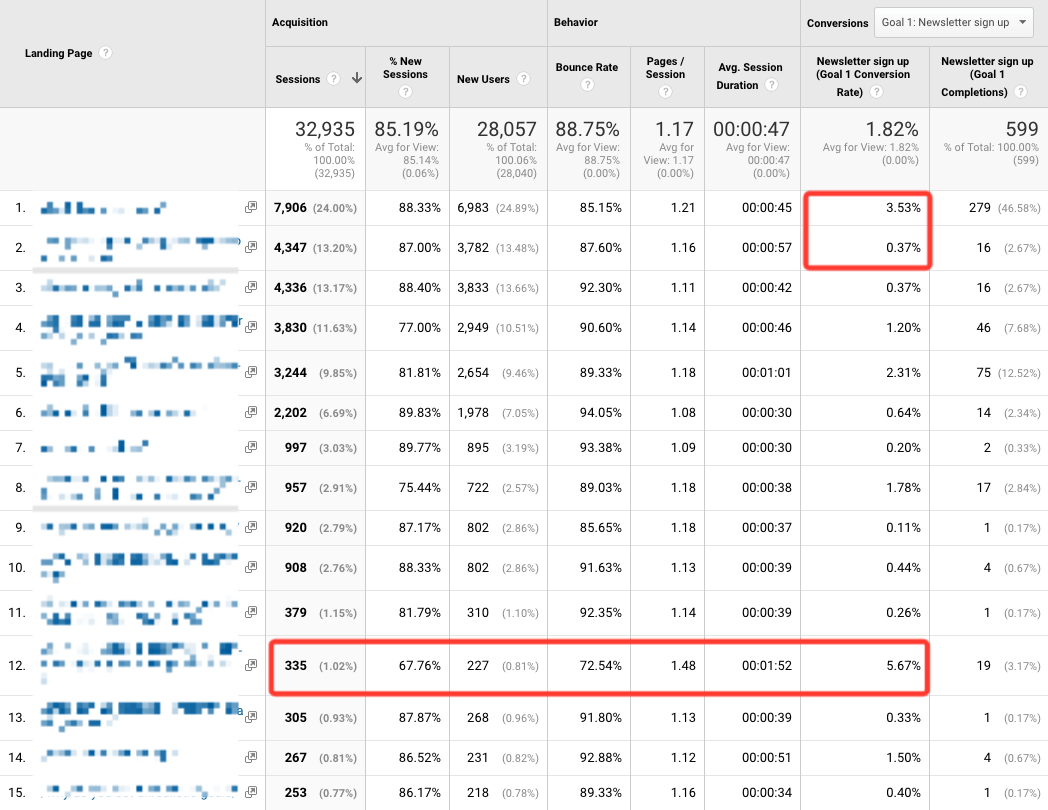
What would you optimize?
Check it – the site’s top blog post has a pretty decent conversion rate. But the number two blog post (measured by traffic) doesn’t.
Further down the list, post #12 has the highest conversion rate, but doesn’t bring in nearly as much traffic as the top few posts.
This is one way optimize blog posts. Looking at your posts to see which ones are underperforming can help you find low-hanging fruit for optimization.
With this info, you could easily work to add content upgrades and lead magnets to underperforming posts.
On the traffic side of things, re-optimizing old blog posts is a standard tool in the SEO toolkit.
Brian Dean of Backlinko has done a good breakdown on how to use Google Search Console data to improve rankings and traffic on old blog posts.
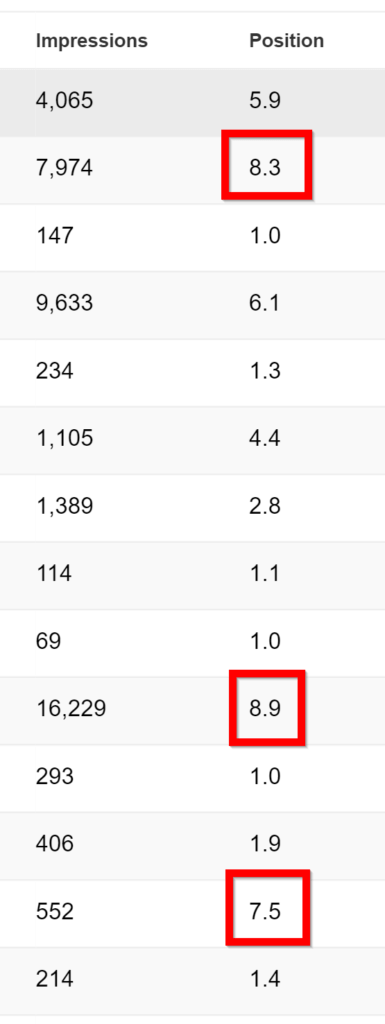
Content that ranks low on the first page or high on the second page is ripe for optimization (Source, Backlinko)
What if you make those changes and…nothing changes?
Conversion rates usually go up when you add a lead magnet – and they keep going up if you make it a customized content upgrade.
But if your content isn’t getting read (or people never see your offer) how will you know?
Nadya Khoja of Venngage and Dana DiTomaso of Kick Point use engagement metrics to figure out if their content is providing a good user experience.
Nadya uses a score based on an average of various engagement metrics in Google Analytics. You can find the details of her process here.
The goal of Nadya’s analysis is to get one number that shows how engaging that piece of content is. Text to image ratio is one of the biggest factors that affects engagement (Source, This is Nadya)
With this average, Nadya can see which posts are engaging and which ones need work. Improving the engagement score of the post (using good content UX and readability) is likely to improve the performance of the content.
Expert Insight: Nadya Khoja on optimizing your engagement

“My team and I at Venngage were interested in seeing how we could improve certain metrics like Time on Page and Bounce Rate. So we decided to conduct some surveys with users who had engaged with our blog.
We showed them a number of articles and tried to get a better idea of what they liked. We learned that articles that had a higher ratio of images to text, like this one about marketing plan templates, tended to appeal more to users because of the formatting and how easy to skim the article was.
We used this research to help re-evaluate our blog strategy which I cover in this post about our content framework. Key takeaway from the calls: less big chunks of text go a long way.“
Dana and Kick Point set up a custom metric in Google Analytics, which lets them figure out whether a visitor fits into one of four standard categories of reading.
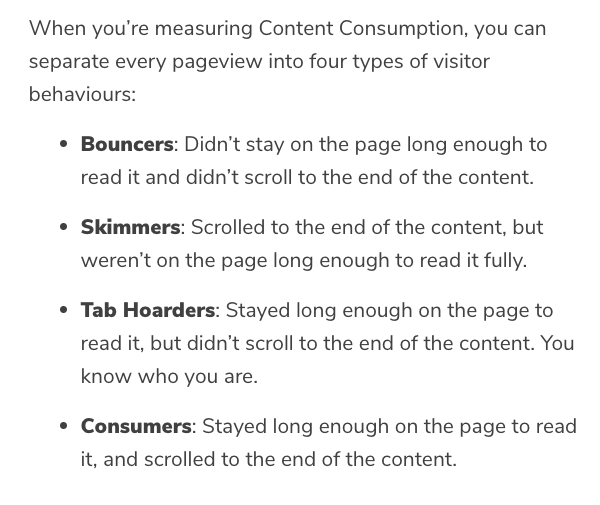
I’m a tab hoarder. Guilty. (Source, Kick Point)
The custom “content consumption” metric is based on two other numbers:
- Content Scroll: How far down the page a visitor is scrolling
- Content Dwell: A measure of how long someone is on the page
What makes content dwell different from standard time on page? Content Dwell is based on the word count of the page – a visitor is marked as someone who “dwells” if they stay on the page longer than the estimated time it would take to read that page.
If a visitor scrolls to the bottom of the page and has been on the page long enough to actually read it, they get marked as a consumer. Otherwise they can be classified as bouncers, skimmers, and tab hoarders.
If you’re looking for ways to optimize your content, those are good places to start. Here are a few other resources that use different approaches:
- Opt-in Copy that Doesn’t Suck: The Criminally Underrated Way to Grow Your Email List
- Are heatmaps actually effective? Interview with HotJar Founder
- How To Improve Your Google Rankings: 9 Steps to Rank Higher Fast Using Analytics
An outside-the-box approach to measurement: Links → Domain Authority → Money
There’s one more approach to measuring content that I haven’t covered yet.
It comes from Andy Crestodina, co-founder and CMO of Orbit Media Studios, and is perfect for people who have…
- Ecommerce businesses with product-specific pages that need traffic
- Agencies who want to get search traffic related to their key services
- Local businesses who want to show up in local searches
- Anyone else trying to rank in search engines for a phrase with high “buying intent”
Andy’s approach is this:
- You create and promote amazing content
- People link to your content, because it’s amazing
- Links raise the authoritativeness of your site in Google
- Your “money pages” start getting more visits and you get more business
In this model, the goal of content isn’t to get sales directly. The goal isn’t even to build brand awareness or attract leads!
The goal is to get links. So that when Andy wants Orbit Media to rank for a phrase like “Chicago web design,” it can.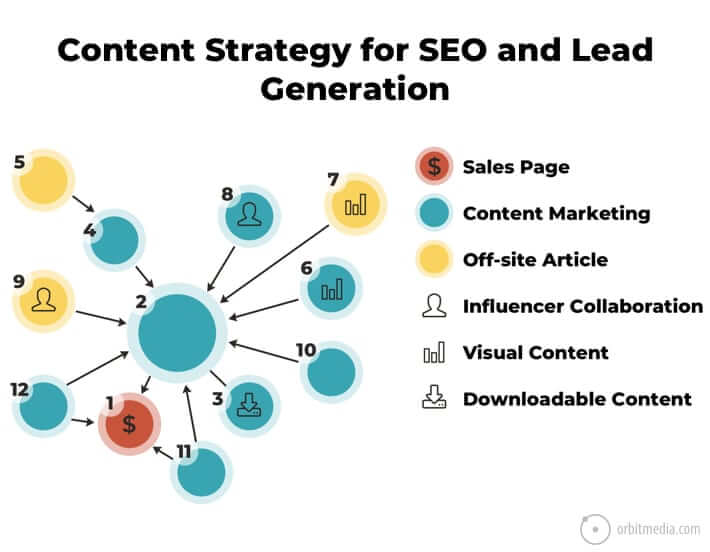
All the content marketing eventually comes back to the sales page. Arrows are links. (Source, Orbit Media)
People on a service or product page are more likely to be qualified visitors – they’re more likely to buy. In order to get more people to those pages, Andy recommends building up the profile of your overall site (using content).
To measure this approach, you would keep track of:
- New links to your content
- Your domain authority
- Traffic/rankings of your “money pages”
An SEO tool like Moz, Ahrefs, or SEMrush can help, but you can likely also get by with Google Analytics and Google Search Console.
You can read more about this approach to content strategy on Andy’s blog. (Notice: the content is so amazing, even I’m sending it a link).
Conclusion: “Easy-to-find metrics are always less important”
If you’re looking for content marketing metrics that are “easy,” you probably won’t find them. Or, you will – but the easy metrics aren’t very useful.
Andy Crestodina argues that (oh look, another link to Andy) visible metrics are less important than invisible metrics.
- Likes and followers are easy to find, and not important
- Traffic and page-level conversion rate are mid-difficulty, and a bit more important
- Customer lifetime value by channel, customer satisfaction, and the value of a given channel are extremely important – and hard to get your hands on
Andy put together this very helpful graphic:
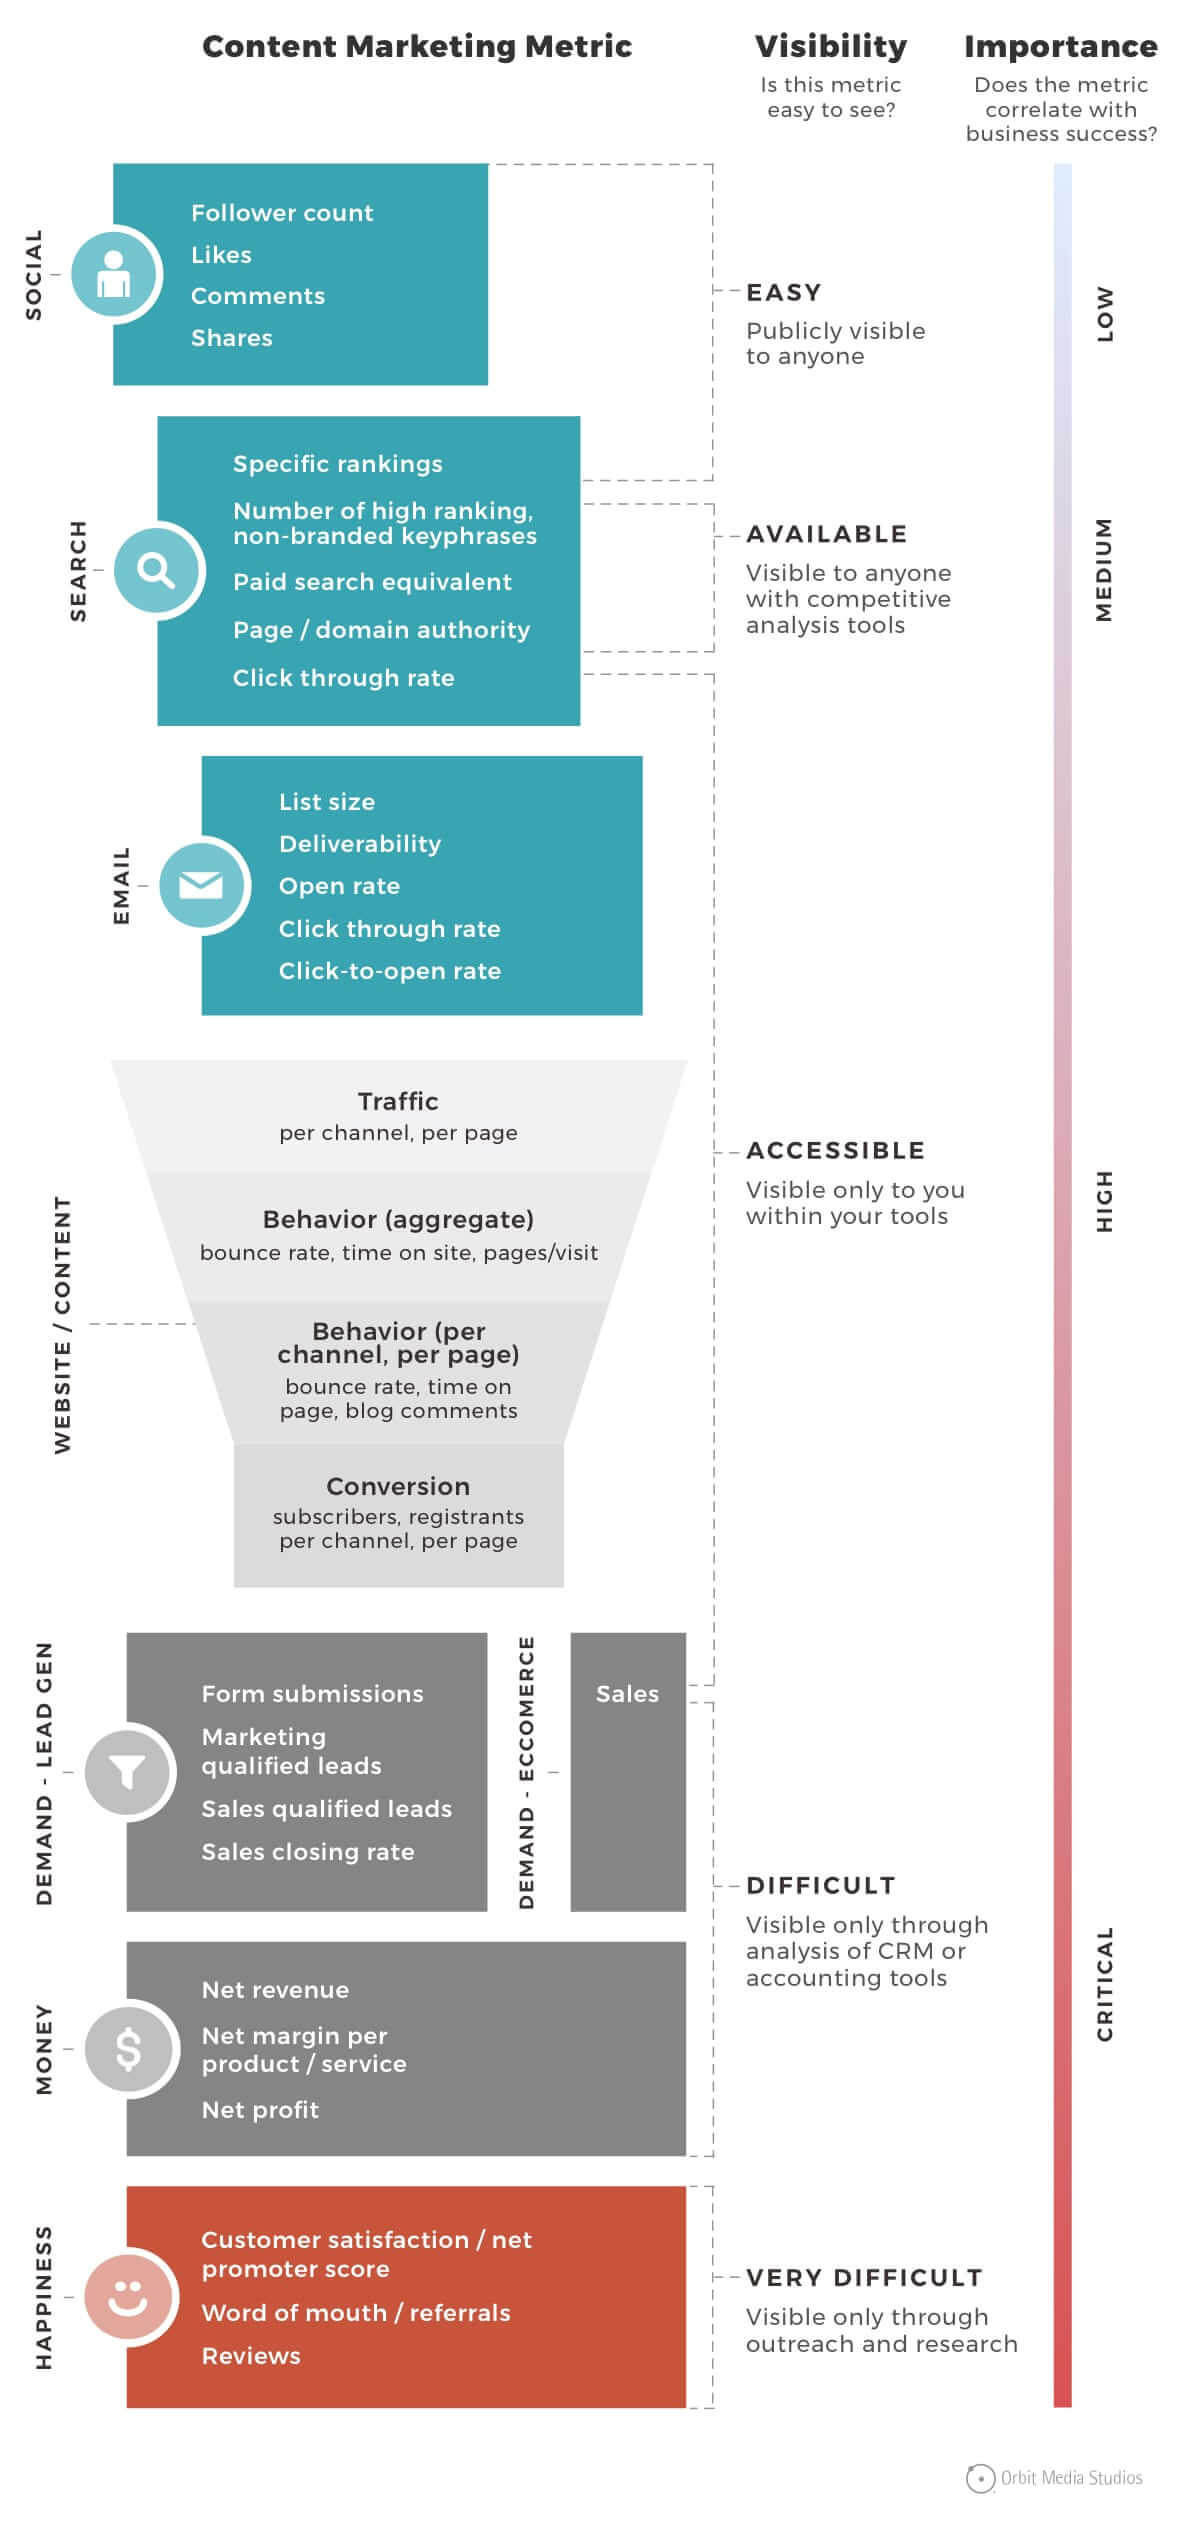
More visible = less important (Source, Orbit Media)
Part of the reason that content marketing has proven so hard to measure is that content creation and measurement are different skill sets.
Most great content creators aren’t statisticians or data scientists. Most people aren’t interested in SQL queries or designing complicated experiments (which go past simple A/B tests on a website).
At the same time, most data scientists are not marketers – and on the rare occasion that their attention turns to content marketing in particular (as opposed to the many other demands for their skill set), they are likely to be biased towards direct attribution.
Content marketing metrics are complicated, and there is no one-size-fits-all metric.
But by choosing the measurement model that fits your business model (and being aware of the dangers of data), you can use metrics to get better results from your content.